The False Breakout Trap
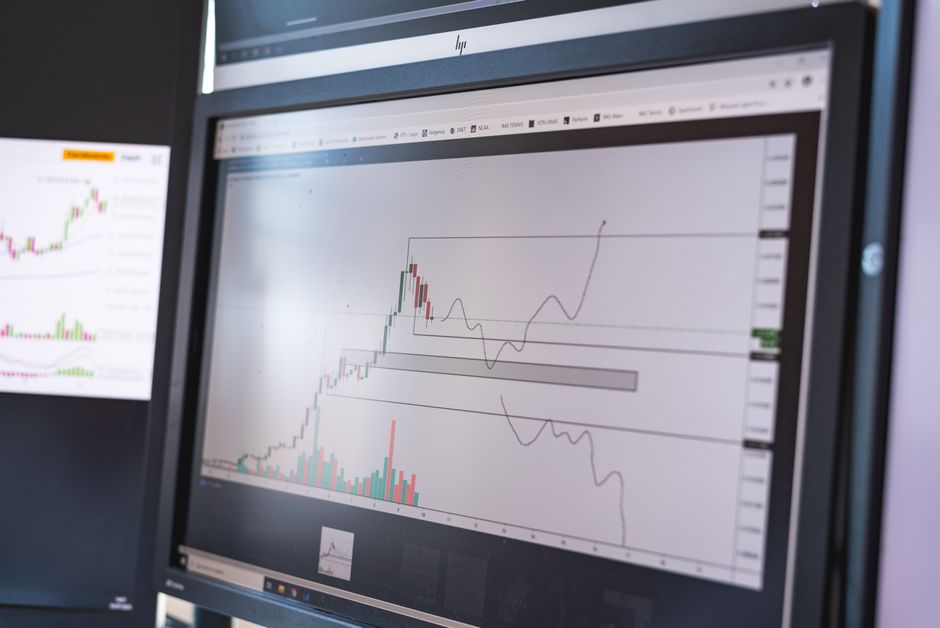
Many traders buy the initial momentum surge at the cash open and get trapped by the immediate reversal. The data at orb trading fifteen minute excel west tracks these specific failures because a false breakout often signals a shift in intraday direction. A common error involves treating a breach of the opening range as a signal of strength without verifying the volume or the rejection candle. This specific price action occurs when price moves beyond a defined level only to snap back into the previous boundaries within a short timeframe.
The Mechanics of the Fakeout
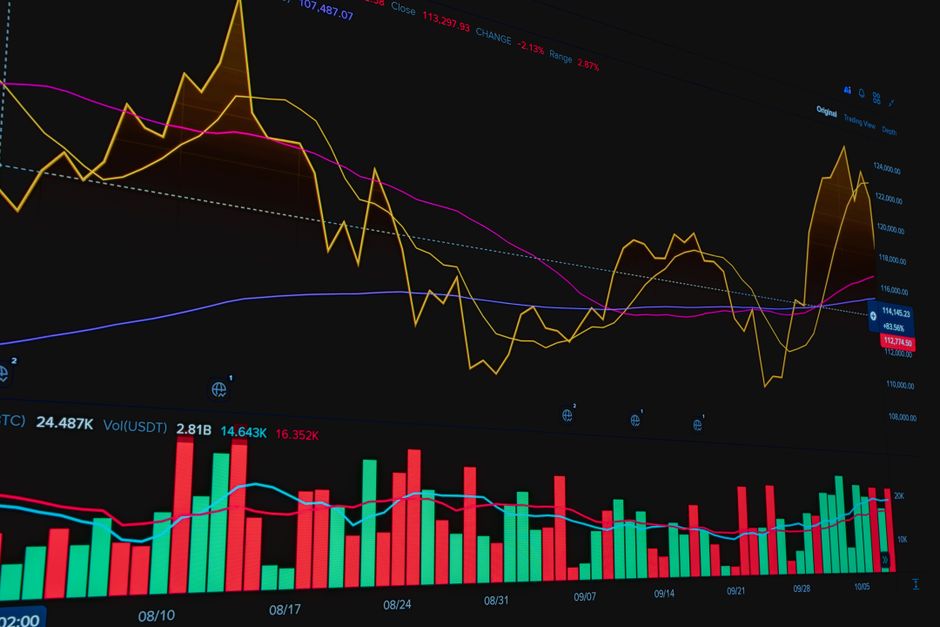
The trap starts with a move past the session high or low established during the first fifteen minutes. Price breaks the level and triggers buy or sell orders from participants expecting a trend. However, the move lacks the necessary liquidity to sustain the push. Instead of finding new buyers, the price hits a wall of limit orders. This creates a long wick on the candle, often seen on a 5 minute chart. This rejection confirms that the breakout attempt was a liquidity grab rather than a true trend initiation.
Identifying the Rejection Pattern
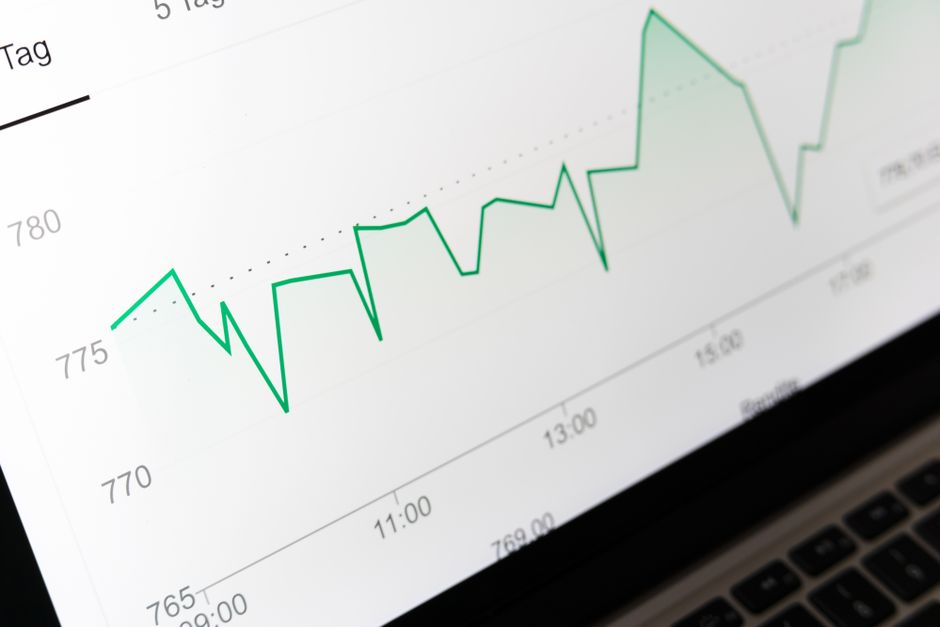
A valid opening range breakout requires sustained price action above or below the boundary. A false breakout shows a sharp move outside the range followed by a rapid return to the interior. This often happens during the first hour of regular trading hours. The speed of the return is the primary indicator. If the price fails to hold the breakout level for even two or three candles, the trap is likely set. Observing the volume during the breach provides additional context. Low volume breakouts are frequently hollow and prone to failure.
Volume and Liquidity Dynamics
Large orders often sit just outside the fifteen minute range to capture momentum. When price enters this zone, these orders act as a ceiling or a floor. A false breakout occurs when the price penetrates these orders but cannot clear the subsequent layer of liquidity. This results in a rapid move back toward the mean. The movement back into the range often carries more momentum than the initial breakout attempt. This reversal provides the actual direction for the remainder of the morning session.
Execution and Risk Management
Waiting for a candle close inside the range prevents entry on the initial false move. A trader looks for the close of a 15 minute candle that rejects the level. This confirms the failure of the breakout. The stop loss stays above the high of the rejection wick. Using the thirty minute range as a secondary filter helps identify if the trap is part of a larger trend reversal. A successful trade relies on the speed of the rejection and the subsequent follow through in the opposite direction.